
Chapter 9 Terminology : Sampling Distributions
-
Population Parameter
Sampling Distribution
(assume all from samples of size = n)
Single Sample Statistic
shape
any
If population is normal then distribution is normal (normal=gaussian=bell-shaped)
or
for means, generally assumed normal if n>30
or
for proportions, generally assumed normal if np>10 AND nq>10
any
center
mean = u
or
proportion = p
Sampling Distribution for Means (mean of means; Note: plural) = ux̄ = u
or
Sampling Distribution for Proportions (mean of proportions; Note: plural) up̂ = p
mean = x̄
or
proportion = p̂
spread
standard deviation of population mean = σ
or
no standard deviation of population proportion in AP Statistics, use IQR or range
Standard Error, SE = standard deviation in the sampling distribution for means, σx̄ = σ/√n = s/√n
or
Standard Error, SE = standard deviation in the sampling distribution for proportions, σp̂ = √(pq/n)
standard deviation of a sample mean = s
or
no standard deviation of sample proportion in AP Statistics, use IQR or range
-
sampling distribution :
-
of the sample mean, ux
-
of the sample sum
-
of the number of success in a sample
-
of a sample proportion
- sample proportion as a type of mean
-
sample size versus population size
Central Limit Theorem
Point estimators :
-
biased versus unbiased : center : does statistic = parameter?
-
precision versus variability : spread : how much does statistic differ from parameter?
-
Standard Error of Distribution [average distance of centers away from the center of distribution] vs Standard Deviation [average distance of data away from center of data] has multiple uses and formulas.
Rare events and reasonably likely events
Chapter 10 Terminology : Introduction to Inference
-
reasonably likely event
-
rare event
-
proportion
-
confidence interval
-
significance test
-
level of confidence (capture rate)
-
margin of error
-
variation in sampling
-
statistical significance
-
condition (assumptions) for a test
-
null hypothesis and alternative hypothesis
-
test statistic
-
P-value
-
critical values
-
level of significance
-
Type I error and Type II error
-
power of a test
-
one-sided test and two-sided test
-
difference of two proportions
-
confidence interval
-
significance test
-
pooled estimate p̂
-
difference of two proportions from an experiment or observational study
-
significance test
-
confidence interval
Chapter 12 Terminology : Inference for Proportions in Populations
-
plausible population means
-
sampling distribution for s
-
confidence interval for a mean
-
using s as an estimate for σ
-
t-table
-
degrees of freedom
-
confidence level
-
capture rate
-
margin of error
-
t-test
-
t-distribution
-
significance test for a mean
-
statistical significance
-
fixed-level testing
-
null hypothesis and alternative hypothesis
-
test statistic
-
level of significance
-
P-value
-
power
-
transforming to normality using logs and reciprocals
-
robustness of t-procedures
-
15/40 guideline for using t-procedures
-
independent random samples
-
random assignment of treatments to subjects
-
pooled versus unpooled sample variances
-
paired data
-
matched pairs design
-
repeated measures design
-
independent and dependent samples
-
mean difference
Chapter 11 Terminology : Inferences for Distributions (Means in Populations)
- test statistic
- significance test
- confidence interval
- degrees of freedom for inference
Chapter 13 Terminology : Inferences for Tables (Chi-Square Procedures in Categorical Data)
Flowchart courtesy of Bloomington Tutors [https://bloomingtontutors.com/blog/when-to-use-the-z-test-versus-t-test]
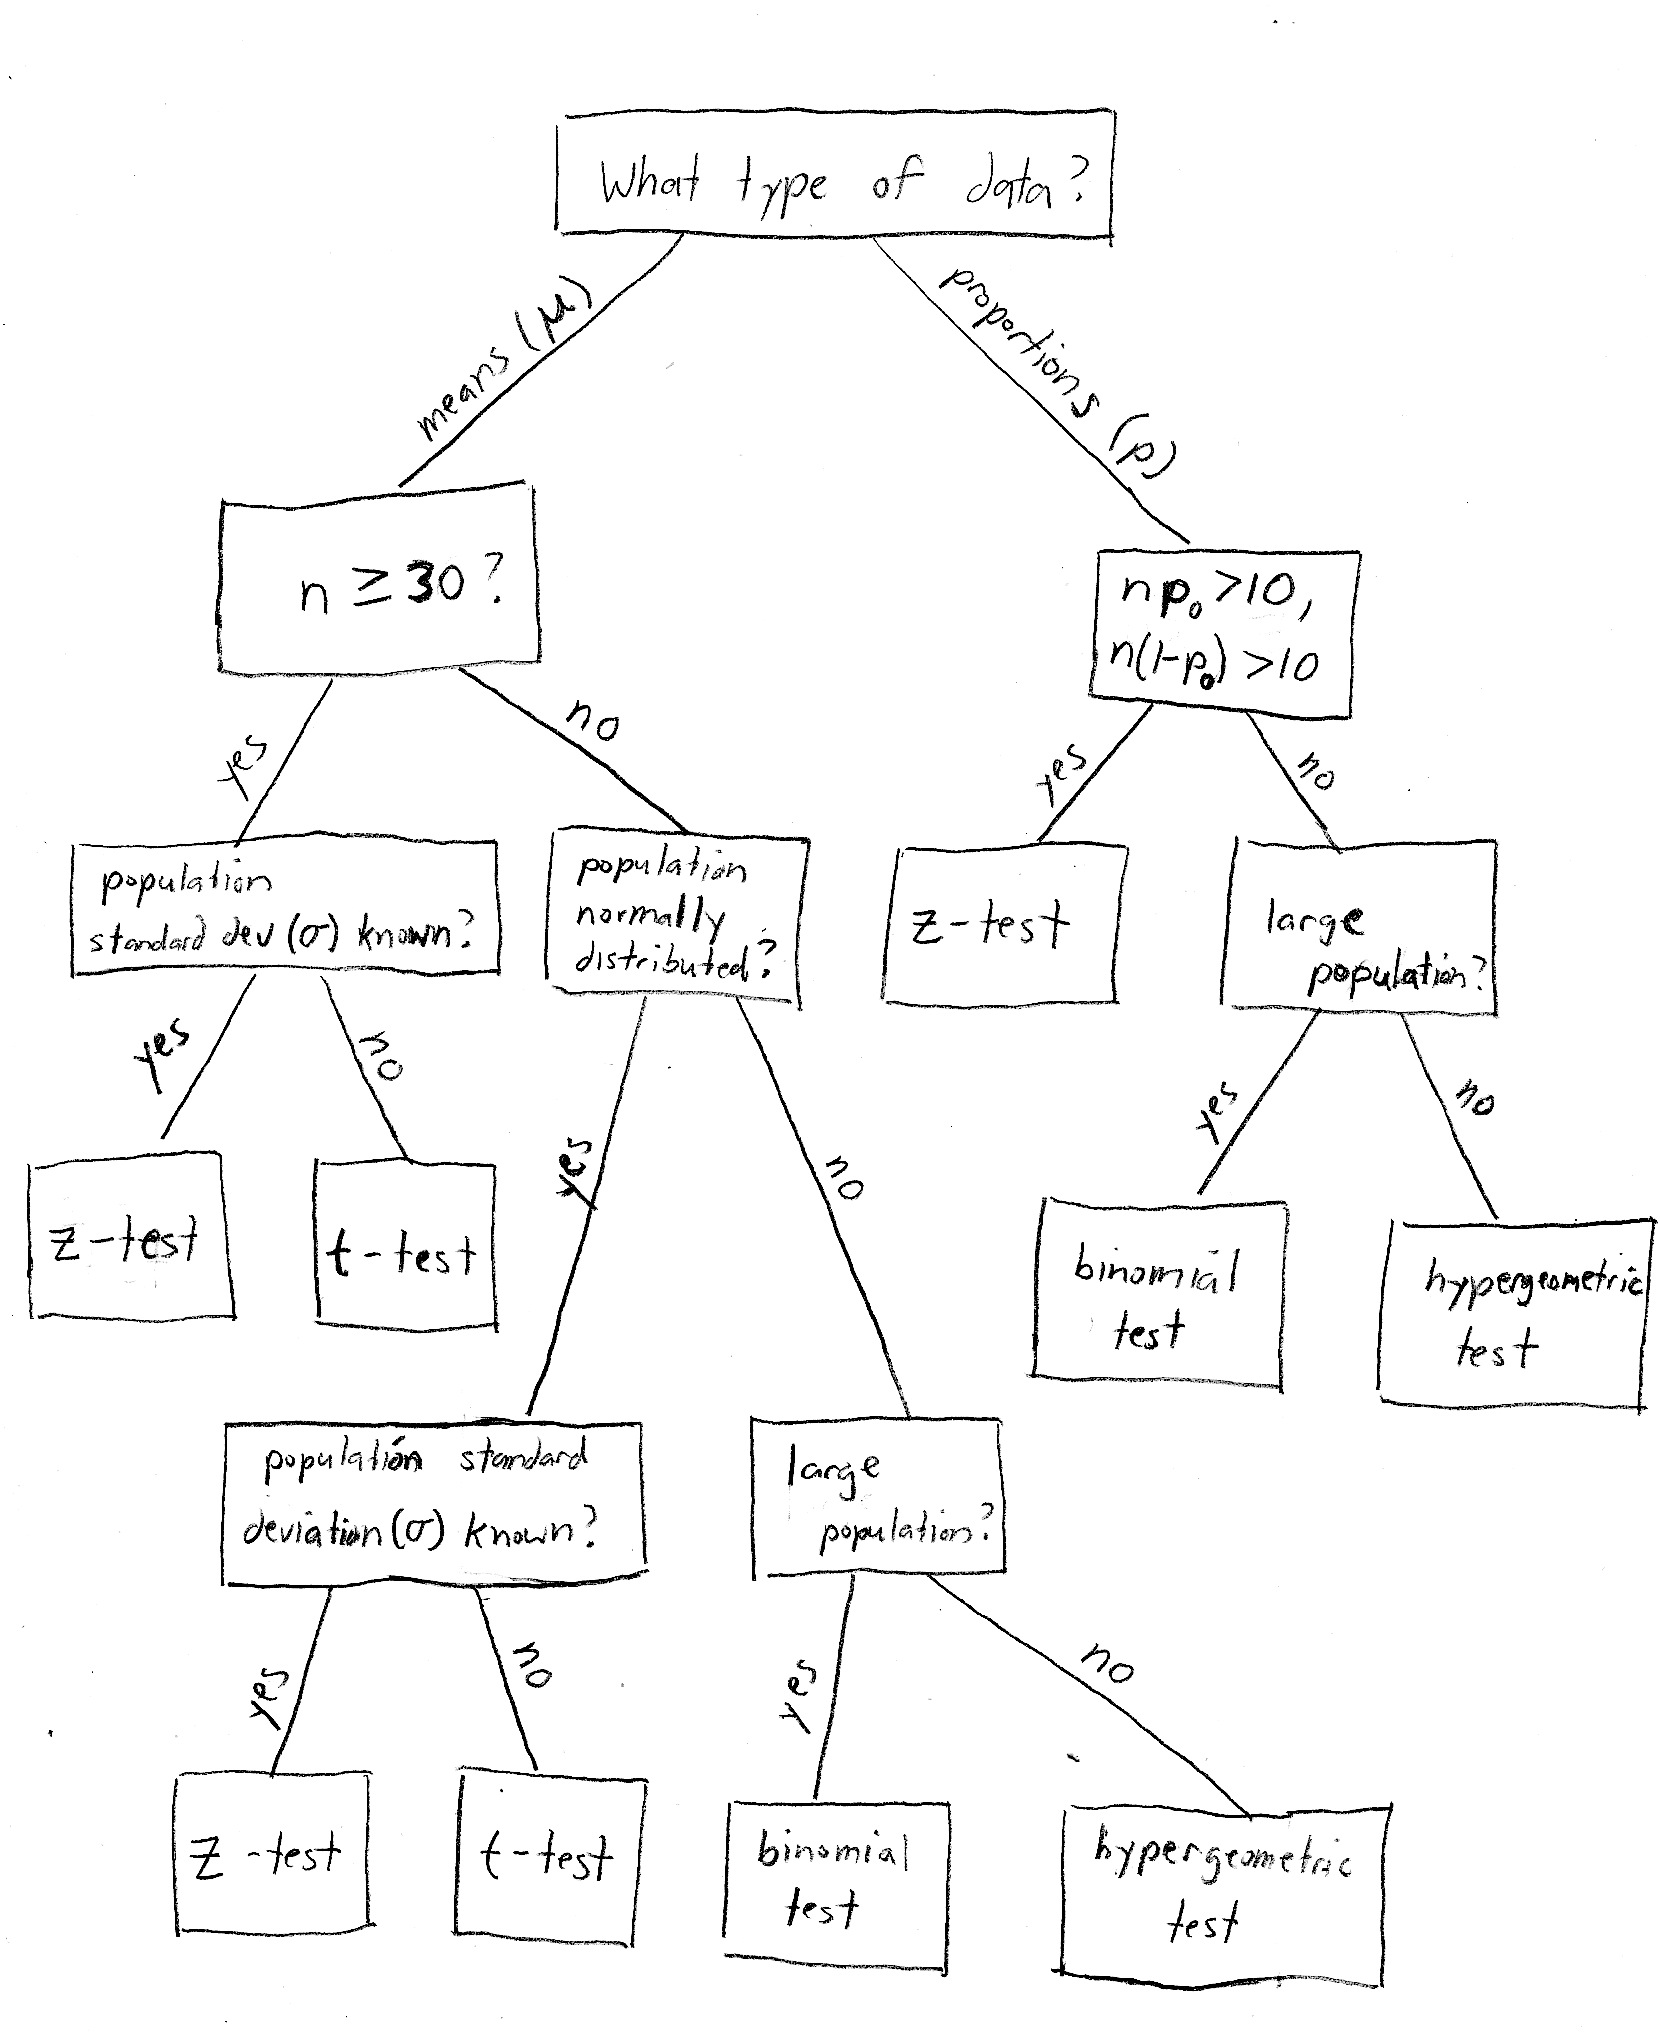
Basically, it depends on four things:
- Whether we are working with a mean (for example, "37 students") or a proportion (e.g., "15% of all students").
- Whether or not we know the population standard deviation (s). In real life we usually don't, but statistics courses like to contrive problems where we do.
- Whether or not the population is normally distributed. This is mainly important when dealing with small sample sizes.
- The size of our sample. The magic number is usually 30 - below that is considered a "small" sample, and 30 or above is considered "large". When the sample size is large, the central limit theorem tells us that we don't need to worry about whether or not the population is normally distributed.
When you're working on a statistics word problem, these are the things you need to look for.
- Proportion problems are never t-test problems - always use z!
- Proportions are always in terms of percentages among 2 options that add to 100%..."winner vs loser" or "like vs dislike"
- However, you need to check that n(p0) and n(1-p0) are both greater than 10, where n is your sample size and p0 is your hypothesized population proportion. This is basically saying that the population proportions (for example, % male and % female) should both be large enough so they will be adequately represented in the sample.
Generally speaking, the problem will explicitly tell you if the population standard deviation is known - if they don't say, assume that it's unknown. The same goes for a normally distributed population - if they don't say "assume the population is normally distributed", or something to that effect, then do not just make up that assumption. Fortunately if the sample size is large enough, it doesn't matter!
Chapter 14 Terminology : Inference for Regression Lines
-
true regression line
-
line of means
-
conditional distribution of y given x
-
variability in x
-
variability in y at a given x
-
standard error in the slope, σb1
-
estimate of the standard error for the slope, sb1
-
slope
Welcome Seniors to the Isle of Dr. Eville.
Rules to Escape the Isle of Dr. Evil
-
There is a 2nd Final Exam and you have just received a ZERO on it...verify the reality!
-
Complete the following tasks to receive an "X" on the 2nd Final Exam thereby Excusing yourself from its consequences and escaping Eville's domain.
Task 1 - Random Award for Just Living
-
On TED, use GoogleMaps to find your house.
Show Dr. Eville and receive your due reward.
Task 2 - Have you been Good Enough?
-
If you have any bathroom passes remaining, turn them in for a Random Reward, 1 per bathroom pass.
Task 3 - Destroy all Juniors
-
On one of the computers is an existing login with a PowerPoint open.
-
Add a slide to the PowerPoint and create an AP Statistics Question for the next set of Juniors and include your name.
-
On the next new slide, write the solution to your AP Statistics Question and include your name.
-
Save the PowerPoint file and show Dr. Eville.
Task 4 - Silence is Golden
Write on a class board your name, a number between 1 and 15 and your favorite "goodbye EHS" quote
-
The random "winning" student who can remain the quietest for the 10 minutes prior to 10 minutes before the bell will receive a piece of Sidewalk Chalk...
...and will be given a pass to write their quote on the concrete in front of the main doors.
-
[remember security videos are always being taken...and consequences for failure will not be tolerated]
Task 5 - Stats Quizzes
Under Dr. Eville's AP Statistics course under RESOURCES tab
take the Practices Quizzes at this link
Task 6 - Stay until the End
Ignore all other students in the hall...they are tempting but will lead you away from your "X"
Email Dr. Eville your ideas for future escape plans
...and don't wake up Dr. Eville until 10 minutes before the bell